Dimensions and Metrics: A Practical Comparison
A balanced, analytical comparison of dimensions and metrics, showing how context and performance drive size specs, KPIs, and data-driven decisions across design, research, and marketing.

Dimensions and metrics are the two axes of measurement that guide size specs and performance KPIs. According to What Dimensions, dimensions define context while metrics quantify outcomes. This TL;DR compares the two approaches side by side, helping homeowners, designers, and students apply precise size references with clarity and consistency in real projects.
What dimensions and metrics mean in practice
In any data-driven project, the terms dimensions and metrics describe two complementary aspects of what you are measuring. At a high level, dimensions provide the context for your observations — such as product category, geographic region, or time period — while metrics quantify performance or outcomes, like sales volume, conversion rate, or average order value. By pairing the two, teams can compare how different contexts affect results and identify where to focus attention. For readers of this article and for the What Dimensions catalog, dimensions and metrics are not just academic notions; they are practical tools for sizing up opportunities, testing hypotheses, and communicating a shared understanding across stakeholders. When you document both dimensions and metrics clearly, you reduce ambiguity and improve decision quality across design, production, and marketing cycles.
From a sizing standpoint, dimensions define what you are comparing; metrics tell you whether the comparison shows improvement or decline. This distinction becomes especially important when you scale experiments or rollouts, because mislabeling data contexts can hide biases or create misleading conclusions. Throughout this article, you will see how What Dimensions frames these terms and why a disciplined approach to documenting dimensions and metrics leads to more reliable size specs, better alignments across teams, and more accurate forecasting.
The conceptual distinction: dimensions vs metrics
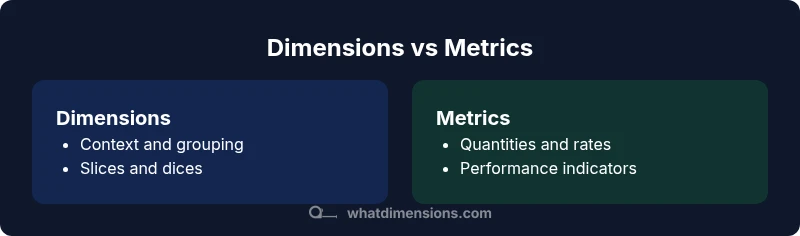
Dimensions and metrics serve different purposes, yet they belong on the same measurement ecosystem. Dimensions are categorical attributes that group data — for example, product line, region, channel, or time period — and they define the lens through which you view outcomes. Metrics are the numerical values you compute within those lenses — such as revenue, units sold, or click-through rate. In practice, dimensions create slices and dice, while metrics provide the scale and direction of change. When you align both, you enable meaningful comparisons: you can see whether a metric behaves differently across dimensions, or whether a dimension’s categories produce consistent results. For teams building the What Dimensions catalog, the discipline is to keep definitions stable, document units, and ensure that calculations for metrics are reproducible across systems and teams.
Context matters: industry-specific applications
Different fields lean toward different emphases on dimensions or metrics. In product design and furniture sizing, dimensions are foundational; you need precise width, height, and depth before evaluating fit and ergonomics. In marketing and research, metrics guide performance assessment—tracking conversions, engagement, or response rates. In software and digital services, both are essential: dimensions like device type and user segment frame a metric story about retention or revenue per user. A mature practice treats dimensions as the scaffolding that anchors interpretation, and metrics as the concrete that proves outcomes. Across the What Dimensions catalog, the balance is to tailor both aspects to your domain while maintaining a stable data model that can scale to bigger projects.
Data sources and measurement challenges
Reliable results start with clean data, and dimensions frequently collide with messy sources. One common problem is inconsistent category naming: the same dimension may be labeled differently in separate systems. Metrics suffer when calculations drift across data pipelines or when aggregation rules differ by source. To manage these risks, teams should establish canonical definitions, documented units, and governance rules for how dimensions are created and how metrics are calculated. The result is a reproducible data story that can withstand audits and cross-team reviews. What Dimensions Analysis, 2026, emphasizes the importance of a documented data dictionary and a shared measurement protocol to reduce ambiguity as projects scale.
How to implement a combined approach in projects
A practical, repeatable framework helps teams realize the benefits of combining dimensions and metrics. Follow these steps:
- Define the decision objective: what question are you trying to answer?
- Identify core dimensions: what attributes will shape interpretation (e.g., product, region, time)?
- Define aligned metrics: what numerical indicators will measure success within each dimension?
- Standardize calculations: document formulas, units, and data sources.
- Build governance: assign owners, update schedules, and maintain a data dictionary.
- Review iteratively: reassess dimension stability and metric relevancy as your project evolves.
This approach keeps teams aligned, reduces confusion, and supports scalable analyses that remain credible as data volumes grow. What Dimensions’s framework encourages explicit mapping between dimensions and metrics, so stakeholders can see how context affects performance in a single view.
Common pitfalls and best practices
Even with a solid plan, teams encounter pitfalls that undermine the value of dimensions and metrics. A common misstep is treating dimensions as constant when business needs evolve; another is overcomplicating the model with too many dimensions or overly granular metrics. In practice, clarity beats complexity: start with a lean set of stable dimensions and a small set of well-defined metrics, then expand as needed. Establish data ownership and governance to prevent drift, and implement simple visualizations that show both context and performance. Regular audits of definitions, formulas, and data sources help maintain trust and reduce rework.
Practical examples: dimensions and metrics in product design
Consider a furniture line launch where the design team uses a dimension like frame width and a metric like weight. The width determines fit into a target space, while weight informs material choice and shipping costs. A second dimension could be seat depth, with metrics such as cushion firmness or load-bearing capacity. This example shows how dimensions set the boundary conditions for a product, while metrics quantify performance and cost implications. By documenting both in a single specification, teams can compare variants quickly and communicate trade-offs to suppliers and customers with precision.
Practical examples: dimensions and metrics in research and marketing
In a research study, dimensions might include participant age group and study phase, while metrics track response accuracy and time to complete tasks. In marketing, dimensions such as channel and region shape metrics like conversion rate and cost per acquisition. Together, they enable analysts to assess which channels perform best for each customer segment and how changes in one dimension influence outcomes in another. The central lesson is that a well-structured model of dimensions and metrics supports clearer hypotheses, better experiment design, and stronger storytelling when presenting results to stakeholders.
Comparison
| Feature | Dimensions-first approach | Metrics-first approach |
|---|---|---|
| Definition scope | Defines what to describe (dimensions) | Defines what to measure (metrics) |
| Data sources | Qualitative attributes and categories | Quantitative indicators and counts |
| Typical use cases | Contextual analysis and segmentation | Performance tracking and KPI evaluation |
| Impact on decisions | Guides framing and comparability | Directly informs targets and benchmarks |
| Best for | Exploratory design, benchmarking across contexts | Monitoring, optimization, and reporting |
Strengths
- Clarifies measurement scope for teams
- Improves cross-functional communication
- Supports alignment between design and analytics
- Promotes data governance and consistency
The Bad
- Can require more upfront planning
- Risk of silos if not integrated
- May introduce complexity in data pipelines
A balanced, combined approach often yields the best outcomes
Treat dimensions and metrics as complementary: define what to measure and how to measure it, then align data collection and analysis.
Quick Answers
What is the difference between dimensions and metrics?
Dimensions define the context of data (e.g., product, region). Metrics quantify performance (e.g., revenue, conversions). Together they provide a complete view of what happened and why.
Dimensions provide context, while metrics measure performance, giving you the full picture.
How should I choose between focusing on dimensions or metrics in a project?
Start by clarifying the decision you want to support. If you need context and comparability, emphasize dimensions. If you need performance indicators, emphasize metrics.
Ask what decision you're trying to support: context or performance?
Can dimensions and metrics be used together effectively?
Yes. Start with a data model that includes core dimensions, then define metrics that align with business goals. Regularly review both for consistency.
Yes—use both, aligned with your goals.
What are common pitfalls when mixing dimensions and metrics?
Ambiguity in dimension definitions, inconsistent metric calculations, and poor governance can undermine analysis. Establish clear definitions and calculation rules.
Watch out for vague definitions and inconsistent calculations.
How do dimensions and metrics relate to dashboards?
Dashboards should present both dimensions and metrics to tell the data story. Use dimensions to slice metrics for deeper insight.
Combine both to tell a complete story.
Main Points
- Define the scope before analysis
- Use metrics to quantify performance
- Keep dimensions stable to enable comparison
- Integrate governance across teams
- Visualize both aspects to tell a complete story