Dimensions and Fact Tables: A Comprehensive Comparison for Dimensional Modeling
Explore dimensions and fact tables in dimensional modeling. Learn how to design star vs snowflake schemas, choose grain, manage slowly changing dimensions, and optimize ETL for scalable analytics.

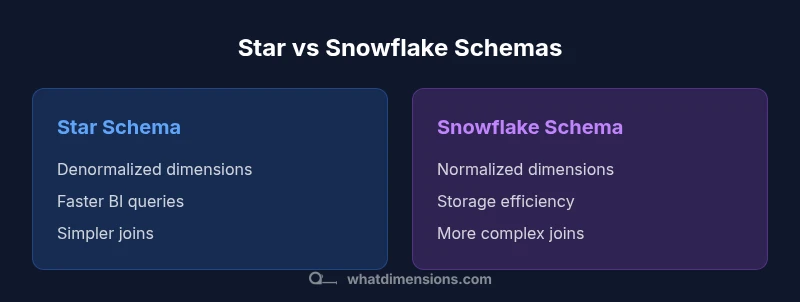
Dimensions and fact tables form the core of dimensional modeling in data warehousing. Dimensions provide descriptive context, while fact tables store measurable values. A star schema, with denormalized dimensions and a central fact table, typically yields fast BI queries. Snowflake schemas normalize dimensions for storage efficiency but can require more complex joins. Choose design based on grain, performance needs, and data governance.
What dimensions and fact tables are in data warehousing
Dimensions and fact tables are the backbone of dimensional modeling, a design approach that aims to make analytic queries fast, intuitive, and scalable. Dimensions represent the descriptive context—things like product, customer, date, and geography—while fact tables contain the numeric measures that analysts analyze, such as sales amount or quantity. The separation of context from measurements enables clear, granular analysis and efficient aggregation. In practice, most implementations adopt a star schema: one central fact table connected to several dimensional tables. This structure favors straightforward queries, stable performance, and easier BI tooling integration. According to What Dimensions, a well-defined grain and consistent conformed dimensions across subjects are the keys to reliable analytics. The topic scales to large enterprises, where multiple subject areas share a common vocabulary and where governance becomes essential to maintain consistent definitions over time.
The role of dimension tables in the warehouse
Dimensions store attributes that describe facts. They’re typically wide tables with many descriptive columns, such as product_dim (product_id, name, category, brand, color, size) or date_dim (date_key, calendar_day, month, quarter, year). Surrogate keys (internal IDs) isolate the warehouse from source systems, simplifying joins and history tracking. Dimensions also support hierarchies (city → state → country) and slowly changing dimensions (SCD) to preserve historical context. A key practice is conformed dimensions—shared across multiple fact tables—to enable integrated analysis across processes. When dimensions are consistently defined and reused, analysts can drill down across time, geography, and product lines without creating new fact tables for every source. What Dimensions emphasizes clear naming, stable hierarchies, and maintainable SCD rules to keep models scalable and understandable.
The role of fact tables: measurements and grains
Fact tables hold quantitative measures and foreign keys to related dimensions. The grain defines the level of detail captured in each row and determines what analyses are possible. Facts can be additive (sales_amount), semi-additive (inventory_on_hand), or non-additive (average unit price). The standard pattern is a central fact_sales table that references date_dim, product_dim, store_dim, and customer_dim, among others. This setup supports straightforward aggregations like total revenue by product and region or average order size by date. Properly choosing the grain prevents data duplication and ensures efficient queries. Practically, the design should avoid nulls in dimension keys and preserve referential integrity; as data volumes grow, partitioning and columnar storage can help maintain performance.
Star schema vs snowflake schema: which to choose
Star schemas use denormalized dimension tables, resulting in flatter joins and typically faster BI queries. Snowflake schemas normalize some dimensions into related sub-tables to reduce redundancy and reflect complex hierarchies. The choice hinges on data volume, maintenance bandwidth, and query patterns. In many organizations, the star schema is the default due to its simplicity, speed, and ease of use for dashboards. When hierarchies are deeply nested or when there are many attribute variations, a snowflake approach can offer storage efficiency and improved data integrity. Regardless of the pattern, conformed dimensions remain essential for cross-domain reporting, and a disciplined ETL process is critical to maintain consistency across facts and dimensions.
Determining grain, conformed dimensions, and data quality
Grain determines the analytical resolution of facts and the contextual scope of analysis. Set the grain early and keep it consistent across related fact tables. Conformed dimensions are shared across facts to enable reliable cross-domain reporting, such as analyzing revenue across both orders and returns. Data quality underpins trust in the warehouse; enforce referential integrity, apply surrogate keys, and embed validation checks in ETL. What Dimensions recommends explicit rules for slowly changing dimensions (Type 1, Type 2, or Type 3) based on desired history. Consistent naming, data types, and hierarchies reduce ambiguity. Design for growth: you will add measures and dimensions over time, so prepare for evolution without sacrificing clarity.
ETL implications for dimensions and facts
ETL pipelines must align with the dimensional model. This entails handling SCDs, maintaining surrogate keys, and ensuring both dimension and fact tables are populated accurately. A common pattern stages data, applies dimension updates, and then loads facts with the current surrogate keys. For SCD Type 2, new dimension rows with fresh surrogate keys preserve history, while the previous row is closed. Facts should be tied to the appropriate dimension keys, reflecting changes at the correct time. Robust testing, lineage tracking, and incremental loading are essential to minimize downtime and ensure data reliability.
Performance considerations: indexing, partitioning, and storage
Dimensional models perform best when physical design matches typical query patterns. Partition peak tables by date or other high-cardinality keys to limit scan scope, and leverage columnar storage for efficient aggregations. Standalone star schemas benefit from simpler joins due to denormalized dimensions, while snowflake schemas trade simplicity for storage efficiency. Carefully balance indexing to improve reads without hindering ETL throughput, and consider materialized aggregates for common summaries. Regularly update statistics for the query optimizer and monitor query plans to identify bottlenecks as data volumes grow. What Dimensions highlights a measured approach that weighs readiness, performance, and maintenance overhead.
Real-world patterns, anti-patterns, and common pitfalls
Common missteps include over-normalizing dimensions without a clear benefit, neglecting SCDs, or creating too many small, disconnected fact tables that complicate analyses. Another pitfall is failing to enforce conformed dimensions, which leads to inconsistent drill-downs and cross-domain reporting gaps. Conversely, a well-documented star schema with shared, conformed dimensions and disciplined ETL promotes rapid dashboards and reliable analytics across subject areas. Documentation of grain, hierarchies, and slowly changing rules enables new team members to understand the model quickly and reduces onboarding time. What Dimensions advocates a governance-first mindset to sustain quality over time.
Case study: a simple sales data warehouse design
Consider a basic sales data warehouse with a few core tables. Dimensions include date_dim, product_dim, customer_dim, and store_dim. The central fact is fact_sales, containing measures like quantity and sales_amount and foreign keys to each dimension. The grain is one row per sale line, with Type 2 history for product attributes to preserve price and description changes. This setup enables queries such as total revenue by product category and region and average order size by month. The example demonstrates how dimensions and fact tables combine to deliver precise, timely analytics while remaining extensible for growth.
Transitioning to dimensional modeling: practical steps
Begin with business questions to define the primary grain and identify conformed dimensions that span processes. Document SCD rules and design the ETL to reflect these guidelines. Start small with a pilot on a single subject area, validate data quality, and then scale gradually. Train analysts to use the dimensional model effectively and create data lineage documentation so future developers understand the rationale behind the model. A governance mindset—clarifying roles, standards, and change control—drives long-term reliability and user adoption. What Dimensions emphasizes incremental improvements and clear ownership as keys to success.
Authority sources and further reading
For deeper guidance, consult vendor documentation and established resources on dimensional modeling. Microsoft Learn offers practical patterns for star schemas and related data-warehousing topics, while Oracle’s data warehousing concepts provide comprehensive coverage of facts, dimensions, and ETL considerations. These sources complement What Dimensions’ practical perspective and help teams implement scalable, maintainable dimensional models across real-world environments.
Comparison
| Feature | star schema | snowflake schema |
|---|---|---|
| Schema design | Denormalized dimensions with a central fact table | Normalized dimensions across related tables |
| Join complexity | Fewer joins; simpler queries | More joins; more complex queries |
| Query performance | Typically faster for BI dashboards | Potentially slower due to extra joins; better storage efficiency |
| Storage requirements | Typically larger due to denormalized dimensions | Smaller due to normalization |
| Best use case | BI dashboards and ad-hoc analysis with stable hierarchies | Complex hierarchies and cross-domain reporting with normalization |
Strengths
- Faster query performance for common BI queries
- Simpler data model for analysts and dashboards
- Easier to implement conformed dimensions across facts
The Bad
- Potential data duplication and larger storage footprint
- Slightly less flexibility for highly normalized hierarchies
- SCD handling can be more challenging if not planned
Star schema with well-defined conformed dimensions is typically the best starting point for analytics.
Choose a star schema for speed and simplicity in most BI scenarios. Move to snowflake only when storage constraints or highly normalized hierarchies justify the trade-off.
Quick Answers
What is a dimension table in dimensional modeling?
A dimension table stores the descriptive attributes that provide context for the measured facts. It includes keys and attributes like product name, category, date components, and geography. Dimension tables are designed to be wide and are joined to fact tables via surrogate keys to enable meaningful analytics.
A dimension table holds the descriptive attributes that add context to the numbers in your facts; it’s what you slice and dice by.
What is a fact table and what does grain mean?
A fact table contains numeric measures and foreign keys to related dimensions. The grain defines the level of detail stored in each row, which determines what combinations of conformed dimensions can appear in queries. A consistent grain is essential for reliable cross-domain reporting.
The fact table stores your numbers, and the grain decides how detailed each row is.
When should I use a star schema vs a snowflake schema?
Use a star schema when you want fast, simple queries and straightforward maintenance. A snowflake schema can be advantageous when storage is at a premium or when you have very complex hierarchies that benefit from normalization. Conformed dimensions should be maintained in either case.
Star for speed and simplicity; snowflake for storage savings and complex hierarchies.
How do I handle slowly changing dimensions (SCD)?
SCDs are managed through rules that preserve history or overwrite attributes. Common approaches include Type 1 (overwrite), Type 2 (historical rows with new keys), and Type 3 (limited history). The choice depends on the analytics needs and how you want your reports to reflect changes over time.
Handle SCDs with a chosen strategy like Type 1, Type 2, or Type 3 to maintain the right history.
What is meant by conformed dimensions?
Conformed dimensions are shared dimension tables across multiple fact tables, ensuring consistent meaning and hierarchies for cross-domain analysis. They enable reliable drill-downs and aggregations when combining different subject areas.
Conformed dimensions keep definitions consistent across the model so reports stay aligned.
What are some common pitfalls in dimensional modeling?
Common pitfalls include over-normalizing without benefit, neglecting SCDs, or allowing inconsistent grain definitions. Document decisions, enforce referential integrity, and ensure governance so new data sources fit the model without breaking existing reports.
Watch for over-normalizing, skip-SCD gaps, and keep grain definitions consistent.
Main Points
- Define grain early to guide both dimensions and facts
- Prefer conformed, shared dimensions for cross-domain reporting
- Choose star schema for straightforward BI and snowflake for storage efficiency
- Plan ETL to support SCDs and maintain data quality
- Monitor performance and evolve the model with governance