Dimensions vs Fact Tables: A Data Modeling Guide
A practical comparison of dimensions vs fact tables in data warehousing. Learn grain, design patterns, and when to use each for robust analytics. Includes best practices, common pitfalls, and migration tips from What Dimensions.

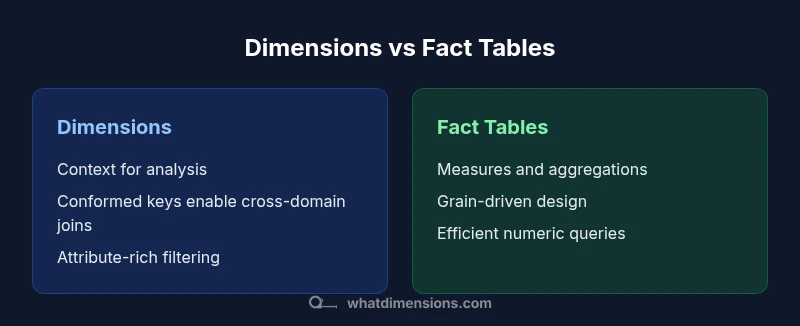
Dimensions and fact tables are two core components of dimensional modeling, each with a distinct role. Use dimension tables for descriptive attributes and conformed keys to enable consistent joins, enabling fast, contextual analysis. Use fact tables for measurable events and aggregations, linked to dimensions for drill-down insights. This comparison highlights practical tradeoffs and guiding design choices.
Core Roles of Dimensions and Fact Tables
In dimensional modeling, dimensions and facts play complementary roles. Dimensions store the descriptive attributes that give context to numeric values, such as product category, customer segment, or geographic region. Facts, by contrast, hold the quantitative measurements that analysts compute and compare—sales amount, units sold, or discounts. The phrase dimensions vs fact tables captures this division of labor: dimensions provide the axes for analysis, while fact tables provide the numerical measures that populate those axes. A well-designed model uses conformed dimensions (shared across subject areas) so that dashboards and analyses can join data from multiple fact tables without inconsistencies. What Dimensions emphasizes that clarity of roles reduces ambiguity in queries and improves maintainability over time. When teams understand which table represents context and which represents metrics, the data model remains extensible as business questions evolve.
This section establishes the foundational distinction that underpins all subsequent design decisions. By keeping dimensions focused on descriptive context and facts focused on numerics, teams avoid common pitfalls such as over-attribute-rich dimensions or under-specified fact grains. The goal is a model that balances ease of querying with robust, auditable data lineage. The interplay between dimensions and facts is also what makes dashboards intuitive: filters and drill-downs rely on dimensions, while aggregations rely on facts. Understanding these roles helps stakeholders communicate clearly about requirements and expectations across analytics projects.
Grain and granularity: the single source of truth
Grain, or granularity, is the single most important design decision in dimensional modeling. The grain defines what a single row in a fact table represents—for example, one sale per day per store, or one login event per user per hour. Dimensions must align with that grain; a dimension attribute cannot sensibly exist at a level of detail that contradicts the fact table’s grain. If you choose a coarse grain for the fact table, detailed attributes in dimensions may be ignored, leading to gaps in analysis. Conversely, a very fine grain can explode table sizes and complicate maintenance. When plans change—such as adding a new sales channel or including returns—teams must decide whether to adjust the grain retroactively or introduce aggregate fact tables for performance. Documenting the intended grain early helps prevent drift as data sources evolve. Effective governance around grain ensures that analyses remain consistent across dashboards and time periods.
Surrogate keys and dimension attributes
Surrogate keys are a foundational technique in dimensional modeling. Instead of relying on natural keys (like a customer ID from an upstream system), most dimensional models use surrogate keys to join facts to dimensions. This provides stability when natural keys change and isolates downstream changes from affecting the fact table’s foreign keys. Dimension attributes describe the object they model—products, customers, regions, time periods—and should be persisted with careful domain design. In practice, a well-constructed dimension includes a concise set of attributes that supports common filters and groupings while avoiding excessive attribute drift. Building defensive defaults, normalization within the dimension (where appropriate), and clear data type choices helps prevent mismatches during joins. The result is a robust, maintainable linkage between measurements and their contextual categories.
Star vs Snowflake schemas: implications for performance
Most dashboards benefit from a star schema: a central fact table surrounded by denormalized dimension tables. This structure minimizes joins, simplifies SQL, and generally yields faster query performance for typical BI workloads. Snowflake schemas, where dimensions are further normalized, can save storage and enforce stricter data integrity, but they require more complex queries and can hinder performance on large datasets. The choice depends on the data source, workload patterns, and maintenance capabilities of the analytics team. For organizations prioritizing speed and ease of use, a star schema is often preferable; for strict governance and space efficiency, a controlled snowflake approach might be warranted. Regardless of shape, maintain consistent naming, clear surrogate keys, and documented relationships to keep queries reliable across teams.
Slowly changing dimensions and history management
Historical accuracy is a core reason to combine dimensions with facts. Slowly Changing Dimensions (SCD) describe how dimension attributes evolve over time. There are several strategies, with SCD Type 2 being the most common for preserving full history: the dimension gets a new row with a new surrogate key and a validity window. Other approaches, like Type 1, overwrite values when they change, effectively erasing history. The right choice depends on business requirements: do you need to see what a product looked like in different periods, or is past context less important? Designing effective SCD processes involves careful ETL planning, robust metadata, and strict governance to ensure that historical analyses reflect the intended periods. A well-managed SCD strategy aligns with the grain of the fact table and supports accurate rollups over time.
Fact table design: grain, measures, and additive rules
Fact tables capture quantitative measurements and must reflect a clear business grain. Each row represents a measurable event, such as a sale, a service transaction, or an interaction. Measures in a fact table should be defined with arithmetic rules: some are additive (like quantity), some are semi-additive (like average balance), and some are non-additive (like ratios). Effective fact table design also considers degenerate dimensions—attributes stored as a dimension that themselves contribute to the grain without expanding necessary joins. Implementing proper foreign keys to dimension tables ensures clean joins, while partitioning and aggregate tables improve performance for time-based queries. In short, a well-designed fact table supports fast, accurate aggregations while remaining aligned with the business grain.
Data quality and governance implications
Quality and governance are essential for scalable analytics. Dimensions should be curated with stable definitions and controlled attribute lists, while facts must be reliable, traceable, and auditable. Metadata should describe the storage location, lineage, and update frequency of each dimension attribute and fact measure. Data quality checks—valid value ranges, referential integrity, and anomaly detection—catch early data issues. Governance frameworks help coordinate changes across domains, ensuring that updates to a dimension don’t inadvertently invalidate a range of reports. When leadership prioritizes governance, analytics teams can trust the data and spend less time reconciling discrepancies. What Dimensions consistently observes is that strong governance reduces rework and accelerates decision-making across business units.
Practical design patterns you can adopt
To translate theory into practice, consider these patterns:
- Start with a domain-driven, business-first design that defines the grain and key business questions.
- Use conformed dimensions to ensure consistent filtering across multiple fact tables.
- Introduce aggregate fact tables for common queries (e.g., daily sales by region) to accelerate dashboards.
- Apply surrogate keys uniformly and document attribute domains and valid values.
- Maintain slowly changing dimensions with a clear policy for history retention.
- Build metadata-driven ETL processes to minimize manual maintenance and enable auditable data lineage. These patterns help teams scale analytics while preserving query simplicity and governance.
Migration and modernization paths
Many teams migrate from flat, denormalized tables to dimensional models in stages. Start by identifying core subject areas (sales, inventory, customers) and define the grain for each fact table. Create a baseline set of dimensions and a few conformed keys to enable initial cross-domain analytics. Next, progressively replace old tables with dimensional equivalents, keeping ETL pipelines backward-compatible to avoid disrupting dashboards. As you evolve, introduce slowly changing dimensions to preserve history, add aggregate fact tables for frequent queries, and refine metadata. Documentation is critical: maintain a living data dictionary that describes each dimension attribute, its allowed values, and its business meaning. A staged migration reduces risk and allows analytics teams to adapt with minimal downtime.
The overarching objective is to deliver a robust, scalable analytical foundation that can grow with the business, while preserving the clarity and accessibility that dimensional models offer.
Real-world examples and takeaways
Across industries, dimensional models frequently underpin dashboards for sales, marketing, and operations. A retail analytics use case might feature dimensions like product, store, time, and customer segment, linked to a fact table with sales, quantity, and discount measures. A financial services scenario could use dimensions for customer tier, product line, and region, with a fact table for revenue and risk metrics. The common takeaway is that a well-structured dimensions vs fact tables architecture enables flexible analytics, faster dashboards, and clearer governance. By documenting grain, standardizing conformed dimensions, and planning for history, teams can respond quickly to new business questions without rebuilding the data model from scratch.
Comparison
| Feature | Dimensions | Fact Tables |
|---|---|---|
| Grain alignment | Descriptive context at attribute level | Event-based or transaction-level granularity |
| Key strategy | Surrogate keys for joins and governance | Foreign keys linking to dimensions |
| Typical use | Filtering, grouping, and drill-down in dashboards | Quantitative measurements and aggregations |
| Performance pattern | Denormalized attributes for fast lookups | Partitioning and aggregation strategies for large volumes |
| History tracking | Historical context through dimension changes (SCD) | Measures captured over time with timestamps in facts |
| Schema choice | Star/snowflake depending on governance needs | Primarily star for BI simplicity vs snowflake for normalization |
| Governance impact | Clear attribute definitions and stable domains | Rigorous data lineage and rule enforcement |
Strengths
- Clear analytical semantics and intuitive querying
- Strong support for slicing, dicing, and filtering
- Conformed dimensions enable cross-domain analytics
- Dimensional modeling improves data governance
The Bad
- Can require upfront design effort and governance
- Fact tables can become very large without proper partitioning
- Star schema may trade normalization for performance
- Snowflake variants add complexity in maintenance
Hybrid approach with conformed dimensions and well-defined grain.
A balanced dimensional model delivers flexibility and performance. Start with conformed dimensions and a clearly defined grain, then add aggregate facts and history tracking as needed.
Quick Answers
What is a dimension table?
A dimension table stores descriptive attributes that provide context for facts, such as product, location, or time. It is used to filter, group, and slice data in analyses.
A dimension table holds the context for your metrics, like product categories or time periods, so you can filter and group results easily.
What is a fact table?
A fact table contains the numeric measures and expected calculations for analysis, such as sales or quantities. It links to dimensions via foreign keys.
A fact table stores the numbers you calculate from, like sales totals, and links to the descriptive attributes in dimensions.
How do I decide the grain of a fact table?
Define the level of detail you need for reporting upfront. The grain determines which dimension attributes can be used and how you aggregate data.
Start by choosing the level of detail you want in reports, then align all dimensions to that level.
What are slowly changing dimensions (SCD)?
Slowly Changing Dimensions capture changes over time. The common approach is to preserve history with SCD Type 2, creating new rows for changes.
SCDs track how attributes evolve, often by adding new rows to keep history intact.
Is a snowflake schema better than a star schema?
Star schemas are typically faster for BI dashboards due to simpler joins, while snowflake schemas offer more normalized data and can save space and enforce integrity.
Star is usually faster for dashboards; snowflake uses more joins but can be more scalable and cleaner in some setups.
How do you migrate from flat tables to dimensional models?
Start with a clear grain, define core dimensions, and replace flat tables gradually. Maintain backward compatibility in ETL and build out conformed dimensions over time.
Begin with the core topics, replace tables step by step, and keep reporting stable during the transition.
Main Points
- Define the grain early to align dimensions and facts
- Favor conformed dimensions for cross-domain analytics
- Use slowly changing dimensions to preserve history
- Balance star schema for performance with governance
- Document data lineage and maintain metadata